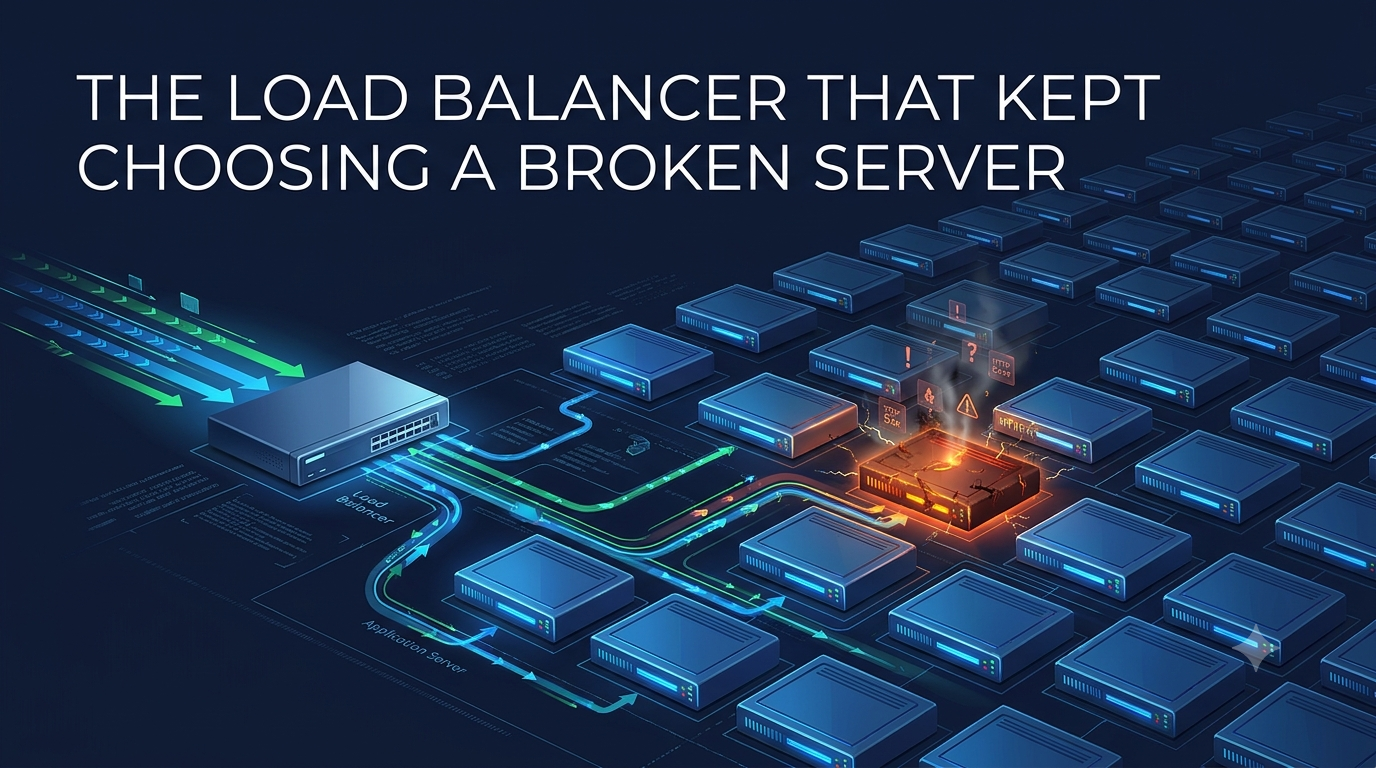
The Load Balancer That Kept Choosing a Broken Server
Imagine this.
You have 200 application instances running behind a load balancer.
Everything looks healthy.
CPU is normal. Memory is fine. Network traffic is flowing. The load balancer is doing its job.
Then, one instance starts returning HTTP 500 errors.
Not slowly. Not after 30 seconds.
It returns a 500 response in just 2 milliseconds.
You might expect the load balancer to stop sending traffic to it.
But something strange happens.
The broken instance keeps receiving requests. In fact, under the right traffic conditions, it can receive a surprisingly large share of the traffic.
The monitoring dashboard is showing errors. Customers are complaining. Your application is technically running, but the experience is getting worse.
And the most interesting part?
Your load balancer isn't necessarily broken. It may simply be doing exactly what you configured it to do.
Welcome to one of those system design problems where a perfectly reasonable algorithm creates a rather unreasonable outcome.
Let's understand why.
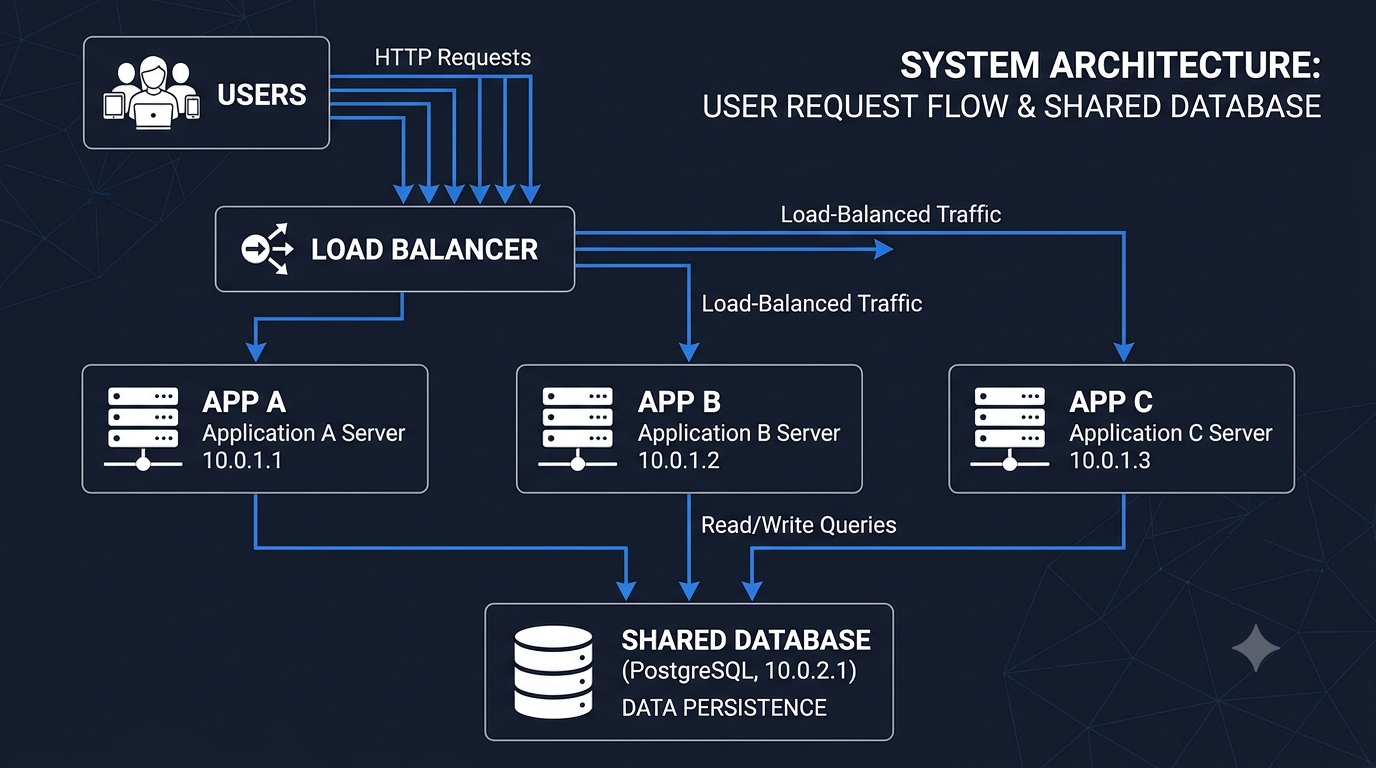
1. First, What Does a Load Balancer Actually Do?
Think about a popular restaurant.
There are 200 tables, but customers don't get to choose where they sit. A host at the entrance directs each customer to an available table.
The host tries to distribute customers so that no single table becomes overloaded.
A load balancer does something similar.
It receives incoming requests and forwards them to available application servers.
A simplified architecture looks like this:
                 Users
                   |
                   |
             Load Balancer
                   |
        +----------+----------+
        |          |          |
      App 1      App 2      App 3
        |          |          |
        +----------+----------+
                   |
                Database
In a real production system, there may be hundreds or thousands of instances across multiple availability zones.
The load balancer helps distribute traffic across those instances.
But here's the catch.
Not every load balancing algorithm understands what a healthy server looks like.
Some algorithms only understand traffic distribution.
Let's look at the one used in our interview question.
2. Least Connections: The Algorithm That Counts, Not Thinks
Least-connections is a load balancing strategy that selects the server with the fewest active connections.
For example, imagine we have three application instances:
| Instance | Active connections |
|---|---|
| App A | 120 |
| App B | 80 |
| App C | 25 |
The load balancer selects App C because it currently has the fewest active connections.
The idea is simple:
- Servers handling more connections should receive fewer new connections.
- Servers handling fewer connections can receive more.
- Traffic should naturally move towards less busy servers.
This works particularly well when requests have different processing times.
For example, one request might take 10 milliseconds, while another takes 5 seconds.
Round-robin doesn't consider that difference. Least-connections can help account for it.
But there is an assumption hidden inside this algorithm.
It assumes that fewer active connections means the server has more capacity to handle work.
And that assumption can be wrong.
Very wrong.
3. The 2-Millisecond Disaster: Why the Broken Server Looks Attractive
Let's return to our 200 application instances.
One instance has a bad configuration. Every request reaching it returns:
HTTP/1.1 500 Internal Server Error
And it does this in 2 milliseconds.
Meanwhile, healthy instances are processing requests normally.
Some requests take 100 milliseconds. Others take 200 milliseconds. A few take longer because they involve database queries or external services.
Now let's see what the load balancer observes.
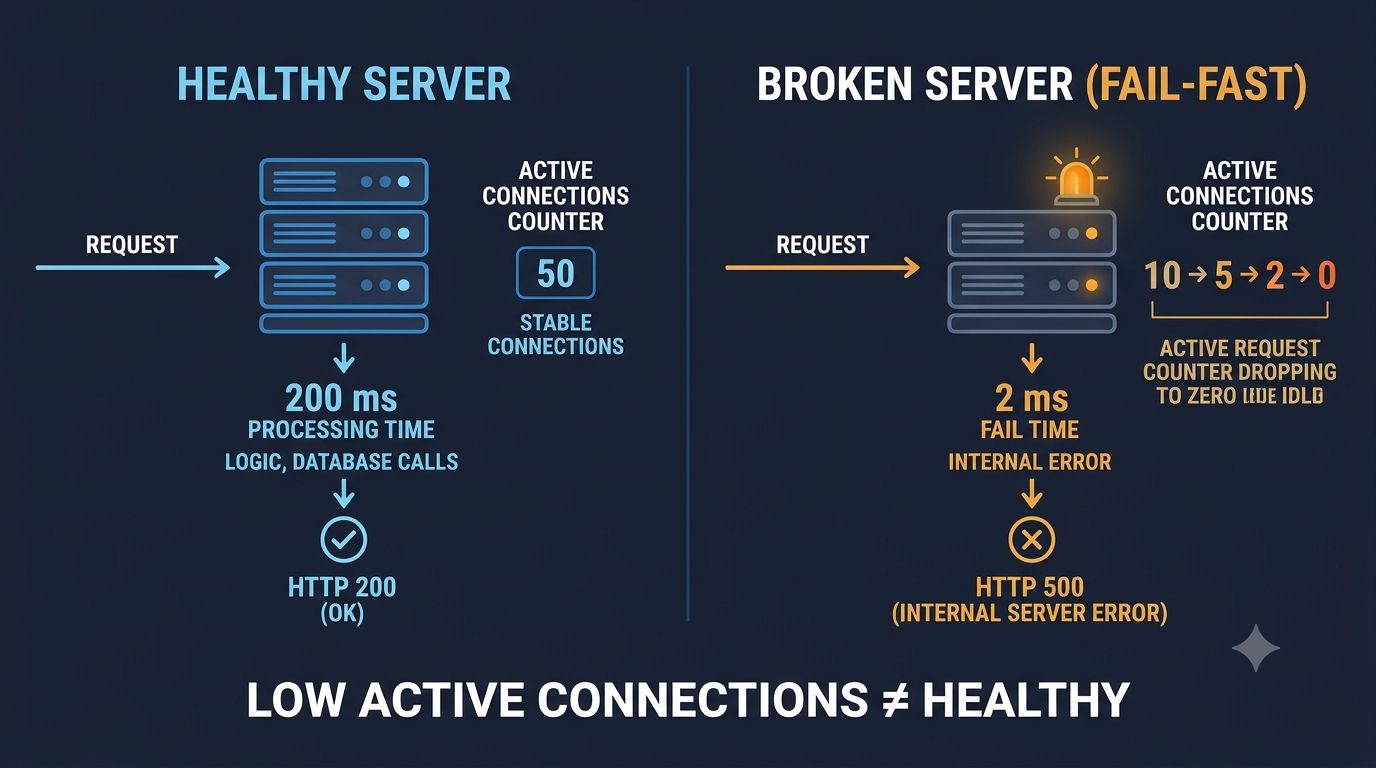
Healthy instance
- A request arrives.
- The server performs validation, executes business logic, queries the database, and returns a response.
- It takes 200 milliseconds.
- During those 200 milliseconds, the request remains active.
Broken instance
- A request arrives.
- The server immediately encounters the bad configuration and returns HTTP 500.
- It takes 2 milliseconds.
- The request completes almost immediately.
If the load balancer measures active requests or connections in a way that reflects this short processing time, the broken instance can quickly return to a very low active-connection count.
And what does least-connections see?
A server with fewer active connections. In other words, the broken server can look like the least busy server in the room.
Imagine a restaurant where one table immediately sends every customer away.
The table is always empty.
The restaurant manager looks at the seating chart and thinks:
"Wonderful. That table has plenty of capacity. Send the next customer there."
That's effectively the problem.
A simple numerical example
Assume requests arrive at a high rate.
For illustration:
| Metric | Healthy instance | Broken instance |
|---|---|---|
| Average request duration | 200 ms | 2 ms |
| Requests in progress at a given moment | Higher | Very low |
| Request success rate | 99% | 0% |
| Actual service health | Healthy | Broken |
The broken server can finish 100 requests in the time a healthy server takes to finish one request of 200 ms. Of course, this does not mean it has successfully processed 100 requests. It has simply failed 100 times.
The load balancer is measuring activity. It is not necessarily measuring usefulness.
That is the core problem.
But what about the 40% traffic figure?
The interview prompt says 40% of traffic reaches the broken instance within a minute.
That figure should be treated as a scenario assumption.
The exact percentage cannot be calculated from the number of instances and the algorithm alone. It depends on request arrival patterns, connection tracking, concurrency, persistent connections, scheduling, and the particular load balancer implementation.
A perfectly even distribution across 200 instances would give one instance around 0.5% of requests.
The interview is testing whether you understand the feedback loop: fast failures can make a server appear lightly loaded, causing it to be selected again.
4. The First Trap: Connection Count Is Not Application Health
This is where the discussion becomes more interesting. A connection is not the same thing as a successful request.
A server can have:
- Very few active connections and still be completely broken.
- Many active connections and still be healthy.
- A healthy network connection but an unhealthy application.
- A running process that cannot reach its database.
- An application that responds to a health endpoint but fails real customer requests.
This is why monitoring only CPU, memory, or connection count is not enough.
Let's take a simple example.
An application server is running normally. Its process is alive. Its port is accepting connections. But someone deployed an incorrect database configuration.
The application can still accept requests, but every request that needs the database fails.
From the operating system's point of view, the server is alive.
From the customer's point of view, the service is broken.
These are two very different definitions of health.
Liveness vs readiness
This distinction matters.
Liveness check Answers: "Is this process alive, or should the platform restart it?"
Readiness check Answers: "Is this instance ready to receive application traffic?"
For example, an instance may be alive but not ready because it is still loading configuration, warming caches, or establishing required dependencies.
A readiness check can prevent traffic from reaching an instance that is not ready.
However, there is a catch.
If every instance depends on the same failing database, marking all instances unhealthy may remove the entire fleet from service.
Health checks must reflect the architecture and the failure being handled. They should not blindly turn every dependency problem into a fleet-wide shutdown.
5. Active Health Checks: Ask the Server Before Sending Traffic
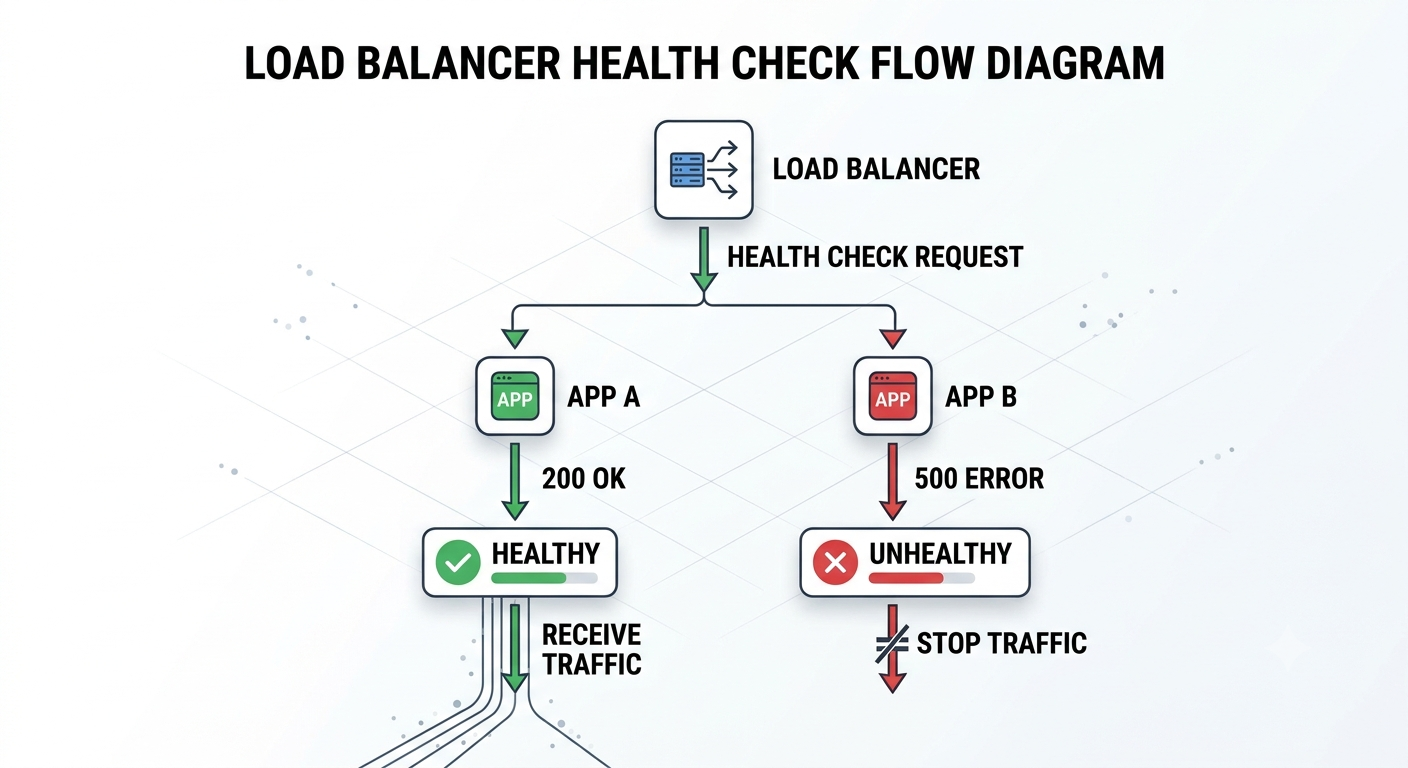
One way to prevent this problem is active health checking. The load balancer periodically sends a health-check request to each application instance.
For example:
GET /health
The application responds:
HTTP/1.1 200 OK
If the server fails the configured health-check criteria, the load balancer can mark it unhealthy and stop routing normal traffic to it.
A simplified flow:
This is useful, but it introduces another question.
What if the health-check endpoint returns 200 while the actual business requests return 500?
For example:
/healthchecks only whether the process is running./ordersrequires a database connection.- The database configuration is broken.
/healthstill returns 200.- Every order request fails.
The load balancer sees a healthy instance. Customers see an application that cannot place orders.
Congratulations. Your health check is healthy, but your service is not.
This is why health-check design matters. The endpoint should check the right things without creating excessive load or coupling every application instance to every downstream dependency.
6. Passive Health Checks: Learn From Real Requests
Active health checks ask the server whether it is healthy. Passive health checks observe how the server behaves when real requests are sent to it.
For example, imagine an instance starts returning repeated HTTP 500 errors.
The proxy or load balancer observes those failures.
After a configured threshold, it can temporarily remove that instance from the healthy pool.
This approach is often called outlier detection.
Instead of relying only on a separate health-check endpoint, the system uses real traffic outcomes to identify an instance behaving differently from its peers.
For example:
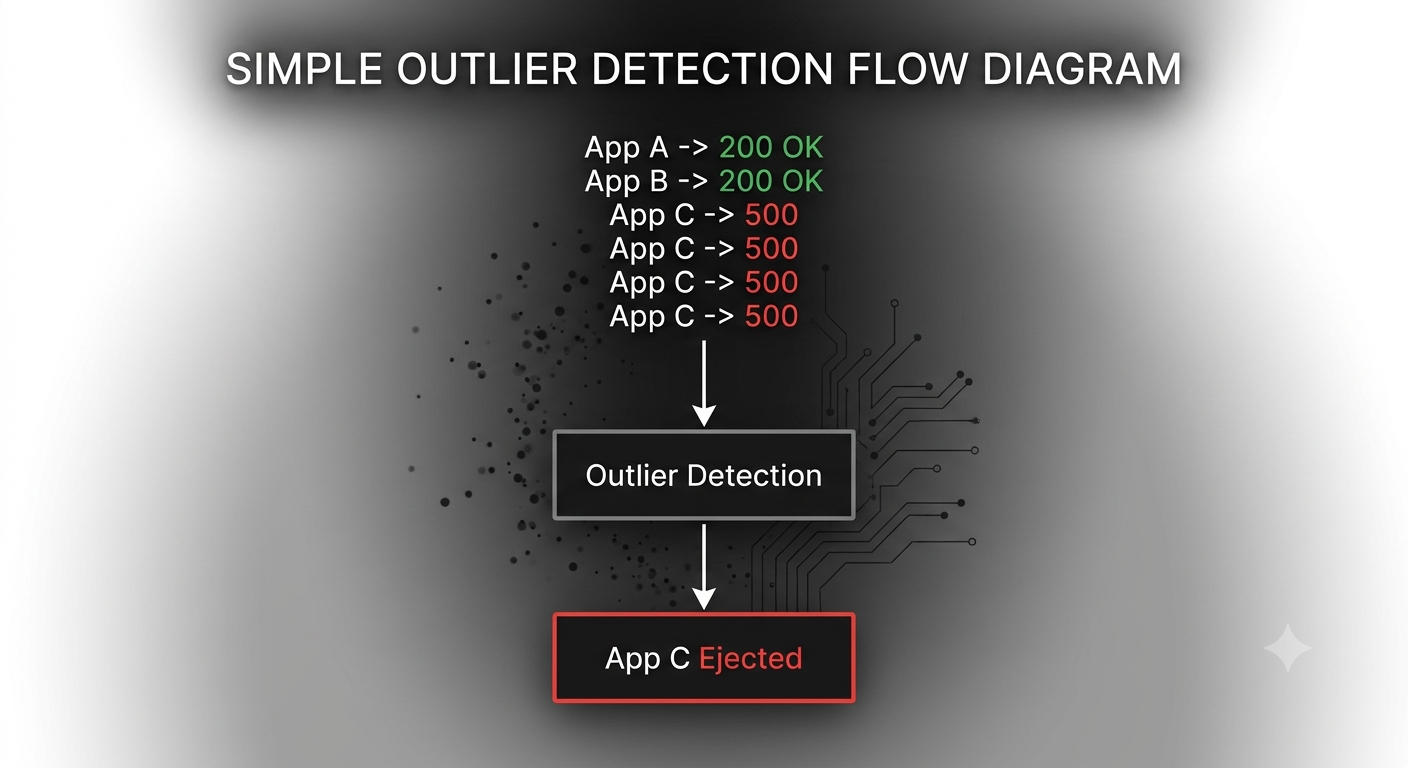
Envoy supports outlier detection based on consecutive 5xx responses, success-rate statistics, and other signals. It can temporarily eject an unhealthy host from the load balancing pool. The exact thresholds and behaviour are configurable. Envoy documentation
This is a powerful approach because it observes actual application behaviour. But don't make the threshold too aggressive.
A single 500 response should not necessarily remove a server from the fleet.
The error could be caused by:
- Invalid user input.
- A business-rule exception.
- A temporary downstream issue.
- A dependency timeout.
- A genuine application failure.
If every individual 500 causes an instance to be ejected, you may end up removing healthy instances because of errors they did not cause.
The goal is to identify unhealthy hosts, not punish every server that has a bad day.
7. Outlier Detection: Remove the Problem, Not the Whole Fleet
Let's look at how a more robust setup could behave.
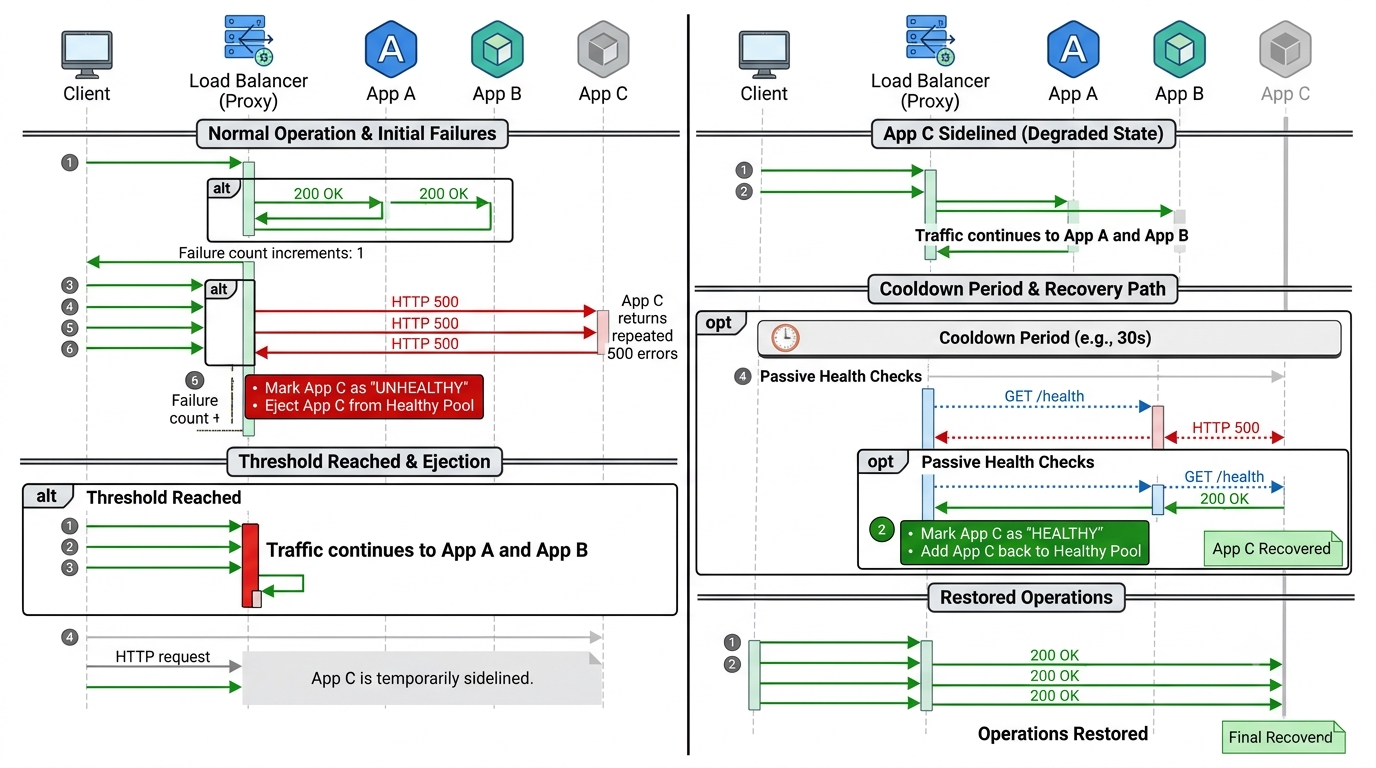
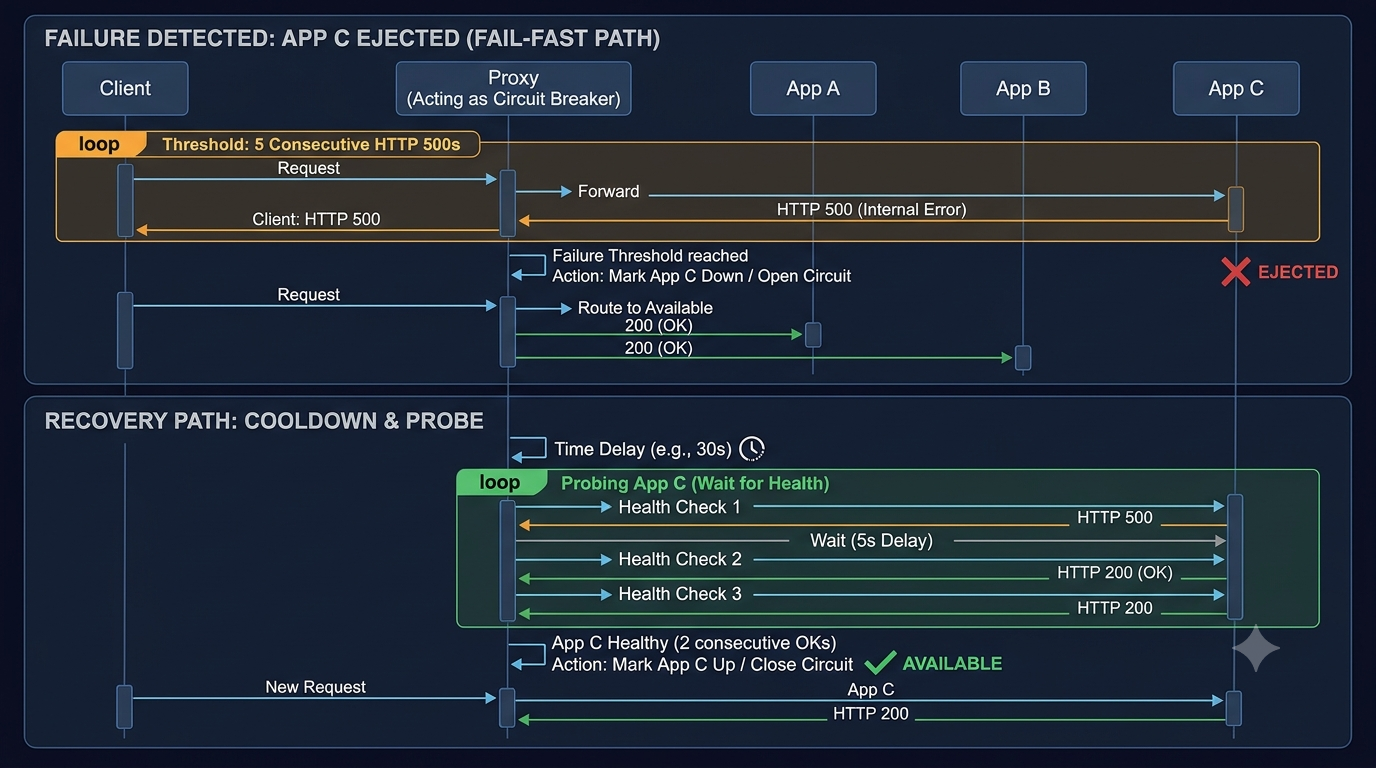
Assume App C starts returning repeated 500 responses. The proxy records those failures.
Once the configured threshold is reached:
- App C is marked as an outlier.
- It is temporarily removed from normal load balancing.
- New requests are routed to other eligible instances.
- App C is allowed time to recover.
- It is tested before being trusted with normal traffic again.
A simplified state transition:
             Healthy
                |
                | Repeated failures
                v
             Suspect
                |
                | Threshold reached
                v
              Ejected
                |
                | Cooldown expires
                v
             Probing
                |
          +-----+-----+
          |           |
        Success     Failure
          |           |
          v           v
        Healthy     Ejected
This is much better than continuously sending traffic to a server that has demonstrated repeated failures.
However, the recovery process is important. If you immediately put a broken server back into service, it may fail again.
A sensible design uses a cooldown period and controlled reintroduction. Some systems also use increasing ejection durations when the same host repeatedly fails.
Envoy, for example, exposes settings for consecutive 5xx detection, ejection duration, and the maximum percentage of hosts that can be ejected. Envoy outlier detection configuration
8. Circuit Breakers: What Happens When the Problem Is Bigger?
So far, we have focused on one unhealthy instance. But what if all 200 instances start failing because a downstream database is unavailable?
Removing individual instances won't solve the underlying problem. It may actually make the situation worse.
Imagine every request reaches the application, which then waits for the same unavailable database.
Requests pile up.
Threads and connections remain occupied.
Memory usage grows.
Clients retry.
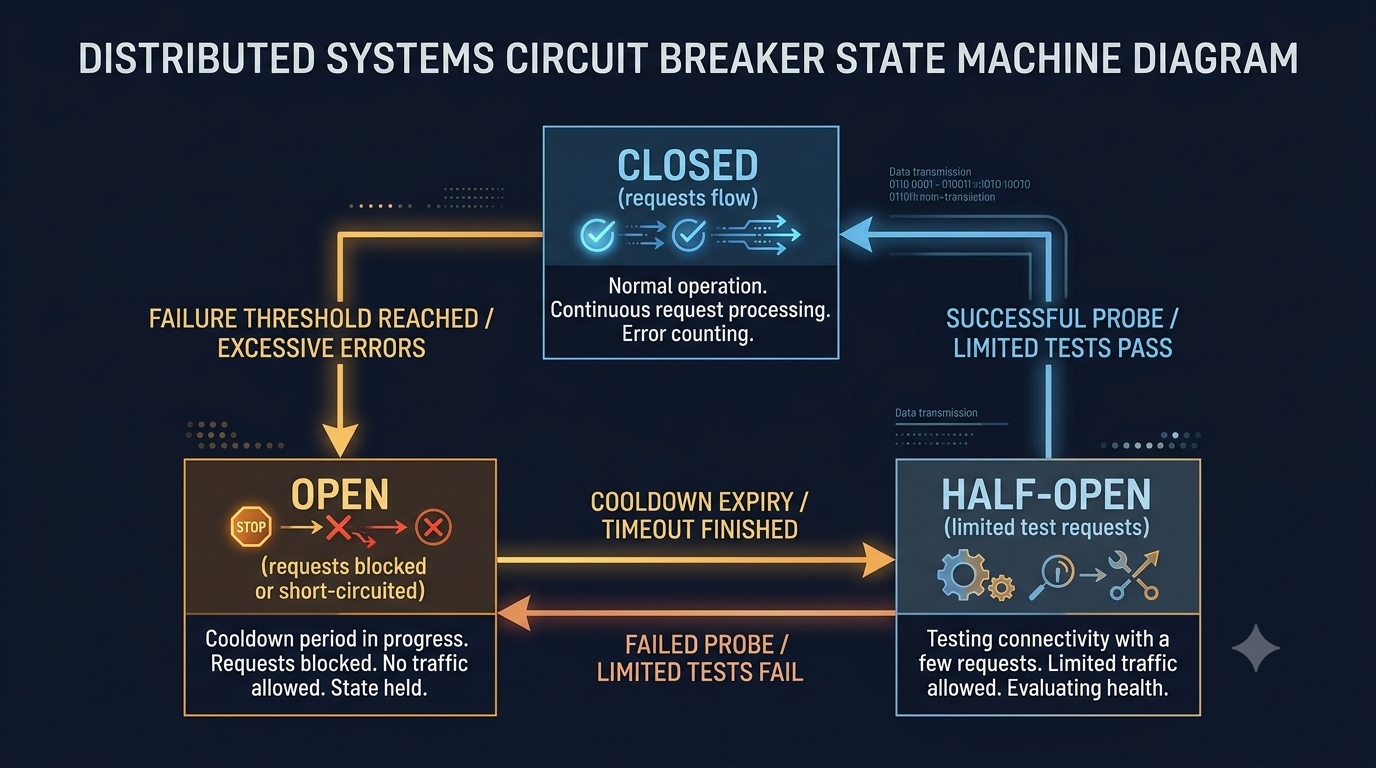
The system becomes increasingly overloaded. This is where circuit breakers become useful. A circuit breaker monitors failures and temporarily stops calls to a failing dependency.
It commonly has three states:
Closed: Requests are allowed through normally.
Open: The failure threshold has been reached. Calls are rejected or short-circuited for a period rather than repeatedly hitting the failing dependency.
Half-open: A limited number of test requests are allowed through to see whether the dependency has recovered.
The idea is simple.
Don't keep knocking on a door that is clearly not opening.
Give the dependency some time to recover.
But remember:
A circuit breaker and outlier detection solve different problems.
- Outlier detection identifies individual upstream instances behaving badly.
- Circuit breakers protect callers and dependencies from repeated failures or excessive load.
They can work together.
9. Retries: The Feature That Can Make Everything Worse
Here's another trap that often gets missed in system design interviews.
- A request fails.
- The client retries.
- The retry fails.
- The client retries again.
Now imagine thousands of clients doing the same thing. Your failing service is receiving even more traffic than before. This is called a retry storm. Retries are useful, but they need guardrails.
A safer retry strategy usually considers:
- Limited attempts: Don't retry forever.
- Timeouts: Don't allow requests to wait indefinitely.
- Exponential backoff: Increase the delay between retries.
- Jitter: Add randomness to retry delays so clients don't all retry together.
- Retryable errors: Retry only failures that might recover.
- Idempotency: Ensure repeating an operation doesn't accidentally create duplicate side effects.
For example, retrying a failed read request is usually simpler than retrying a payment request.
Imagine a payment service processes a payment successfully, but the response gets lost.
The client assumes the payment failed and retries. Without idempotency protection, the customer may be charged twice. That is a much more expensive bug than a failed HTTP request.
Also, retries should not be multiplied at every layer. If the client, API gateway, service, and database driver all retry independently, one original request can turn into a surprising amount of downstream traffic.
Retries are a recovery mechanism, not a magic wand.
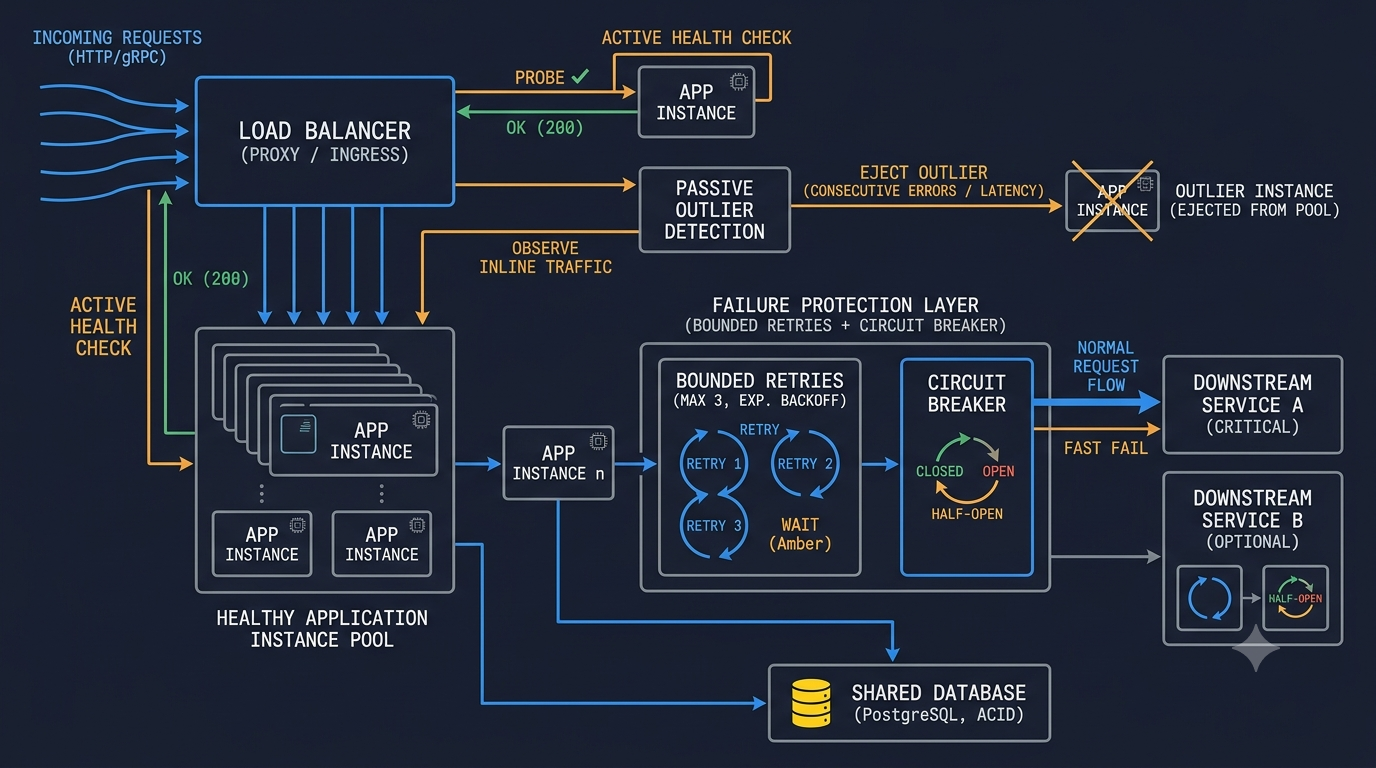
10. What Would a Production-Ready Design Look Like?
Let's bring the pieces together.
For a service with 200 instances, I would not rely on least-connections alone. I would combine load distribution with health signals, failure detection, and controlled recovery.
A simplified architecture:
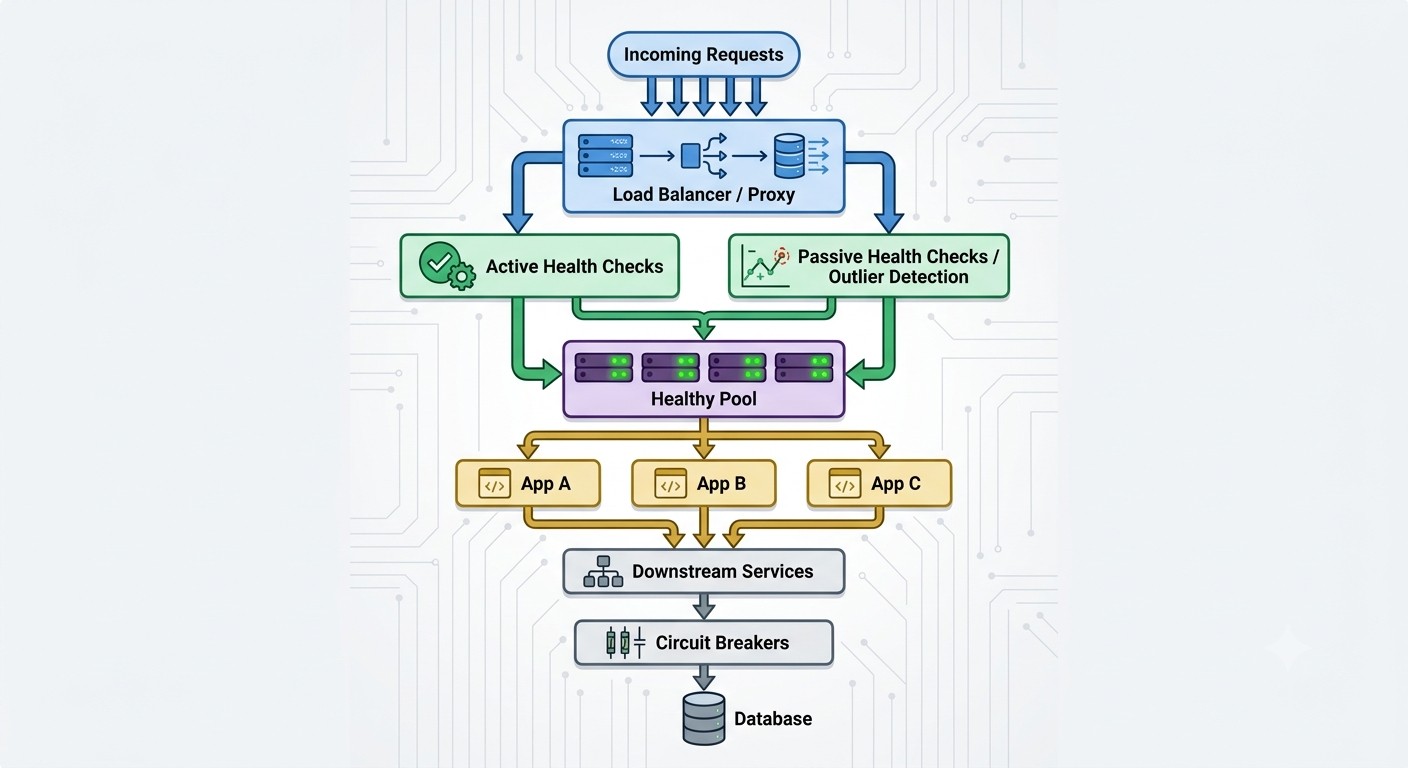
The responsibilities are different:
| Component | Responsibility |
|---|---|
| Load balancing | Distribute requests |
| Active health checks | Check instance readiness |
| Passive health checks | Observe real request failures |
| Outlier detection | Temporarily eject unhealthy instances |
| Circuit breaker | Protect callers and dependencies |
| Retry policy | Recover from selected transient failures |
| Timeouts | Bound how long requests can wait |
| Monitoring | Show what is happening across the fleet |
The important part is that these mechanisms work together.
A load balancer should not be expected to solve every failure mode by itself.
11. What Would I Look at During a Real Incident?
If I saw one instance returning repeated 500 errors while receiving a disproportionate amount of traffic, I would not immediately change the load balancing algorithm. First, I would want to understand what the system is actually measuring.
I would investigate:
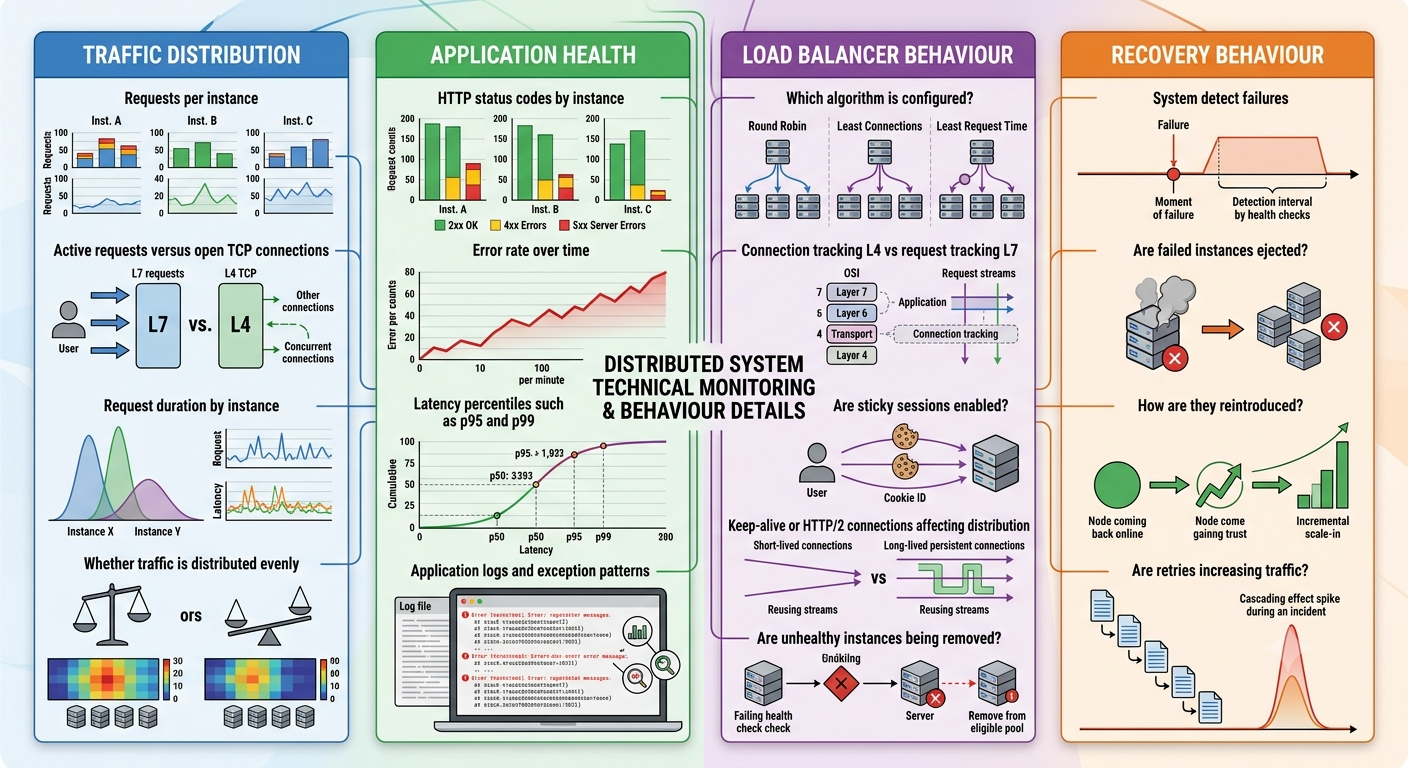
One particularly important detail:
Connection count and in-flight request count are not interchangeable.
With HTTP keep-alive, a TCP connection may remain open between requests. With HTTP/2, several requests can be multiplexed over one connection.
So, a load balancer counting TCP connections may have a very different view of workload from a proxy counting active HTTP requests.
That distinction matters when diagnosing a least-connections problem.
12. The Principal Engineer's Question: What Are We Optimising For?
At this point, we could simply say: "Let's enable outlier detection and move on."
But that is not quite enough. There are trade-offs.
How quickly should we eject an instance?
A low failure threshold detects problems quickly, but it can also eject instances because of temporary or isolated errors. A high threshold avoids overreacting, but customers may experience more failures before the instance is removed.
How many instances can we eject?
If the fleet has 200 instances, removing one is usually manageable. Removing 100 during a widespread dependency failure may be disastrous.
Ejection limits help prevent the health-management mechanism from making an outage worse.
What if every instance is unhealthy?
This is an important edge case. If the system removes too many instances, it may have no healthy capacity left.
Some proxies have a panic or fallback behaviour when too few healthy hosts remain. That behaviour needs to be understood and configured carefully.
How should we bring an instance back?
Immediately returning a recovered instance to full traffic can create another failure.
A safer approach is to allow a controlled recovery period, validate the instance, and gradually restore traffic where the platform supports it.
What is the business impact?
A payment service, a search service, and a recommendation service do not have identical failure requirements.
The acceptable error rate, retry behaviour, timeout, and recovery strategy should reflect the business operation.
This is the difference between selecting a load balancing algorithm and designing a resilient service.
13. The Final Takeaway: A Server Can Be Fast and Still Be Useless
Let's return to the original interview question.
One out of 200 instances has a bad configuration. It returns HTTP 500 in 2 milliseconds. The load balancer uses least-connections.
Why can traffic keep going to the broken instance?
Because the algorithm is optimising for active connection count, not successful request processing.
The fast failures can cause the instance to appear lightly loaded, making it attractive for future selections under certain traffic patterns.
The solution is not necessarily to throw away least-connections. It is to combine traffic distribution with proper health management.
Use active checks to validate readiness.
Use passive checks and outlier detection to identify instances that fail real requests.
Use circuit breakers to protect dependencies.
Use retries carefully, with backoff, jitter, timeouts, and idempotency where needed.
And monitor the actual behaviour of the service, not just whether its processes are running.
Here is the lesson I would take into a Staff Engineer system design interview:
A load balancer can distribute traffic intelligently and still distribute failures very efficiently.
The goal isn't just to send requests to the least busy server.
The goal is to send requests to a server that can successfully handle them.
And sometimes, the server that looks the least busy is the one you should trust the least.
A question for you
Suppose you have 200 instances, and 20 of them suddenly start returning HTTP 500 errors because of a bad deployment.
Would you:
- Wait for active health checks to detect the issue?
- Use passive outlier detection to eject failing instances?
- Roll back the deployment immediately?
- Combine all three, with safeguards to avoid removing too much capacity?
There isn't always one correct answer. The interesting part is understanding the failure, the blast radius, and the recovery time.
That's what makes system design more than drawing boxes and arrows.
It's about understanding how a system behaves when something inevitably goes wrong.
#SystemDesign #LoadBalancing #DistributedSystems #FaultTolerance #Microservices #BackendEngineering #SoftwareArchitecture #TechInterviews #ScalableSystems
About the author
- I am a Lead Data Infrastructure Architect with 13+ years of experience engineering high-throughput data platforms for fintech and consumer apps. I specialize in the Databricks Lakehouse ecosystem, PySpark, BigQuery, and Snowflake. I write about modern data architecture, cloud cost optimization (FinOps), declarative ELT pipelines, and scaling systems to process 100K+ events per second. When I'm not untangling complex legacy databases, I'm building zero-loss data quality frameworks.
Comments
Join the discussionNo comments yet. Be the first to comment.